Dashboard Guide
The PaperTrail dashboard is a self-contained interactive HTML file for exploring your team's paper landscape. No server required — just open in any browser.
Views
The dashboard has four main views, accessible from the top navigation bar.
Map View
The default view — a canvas-based 2D scatter plot where each dot is a paper.
Key features:
| Region | What it does |
|---|---|
| Scatter plot (center) | Papers plotted by semantic similarity. Nearby papers discuss similar topics. |
| Topic labels | Hierarchical cluster labels with colored pill outlines. Zoom in to see subtopics. |
| Topic lines | Lines connecting related topics (configurable thickness, opacity, curve, color). |
| Channel filter (left sidebar) | Toggle channels on/off. Deselected papers fade to ghost dots. |
| Projection buttons | Switch between UMAP (default), t-SNE, and PCA projections. |
| Color By | Cluster (default), Channel, Year, Citations, Engagement, Density, Contributor, Journal. |
| Scale By | Engagement (default), Citations, Year, Uniform. Controls dot size. |
| KDE Background | Density heatmap with configurable bandwidth, opacity, and palette. |
| Topic Lines | Toggle and configure connection lines between topic clusters. |
| Time slider (bottom) | Scrub through time or press play for chronological animation. Papers fade in smoothly. |
| Tool buttons (right) | Pan, lasso select, rectangle select, reset zoom, save as PNG. |
Interactions:
- Scroll to zoom in/out
- Click + drag to pan
- Click a dot to see paper details
- Click a topic label for topic info popup (paper count, top contributors, top papers)
- Lasso/rectangle to select multiple papers
- Hover over topics for paper count tooltip
3D View
WebGL-powered 3D scatter plot using Three.js.
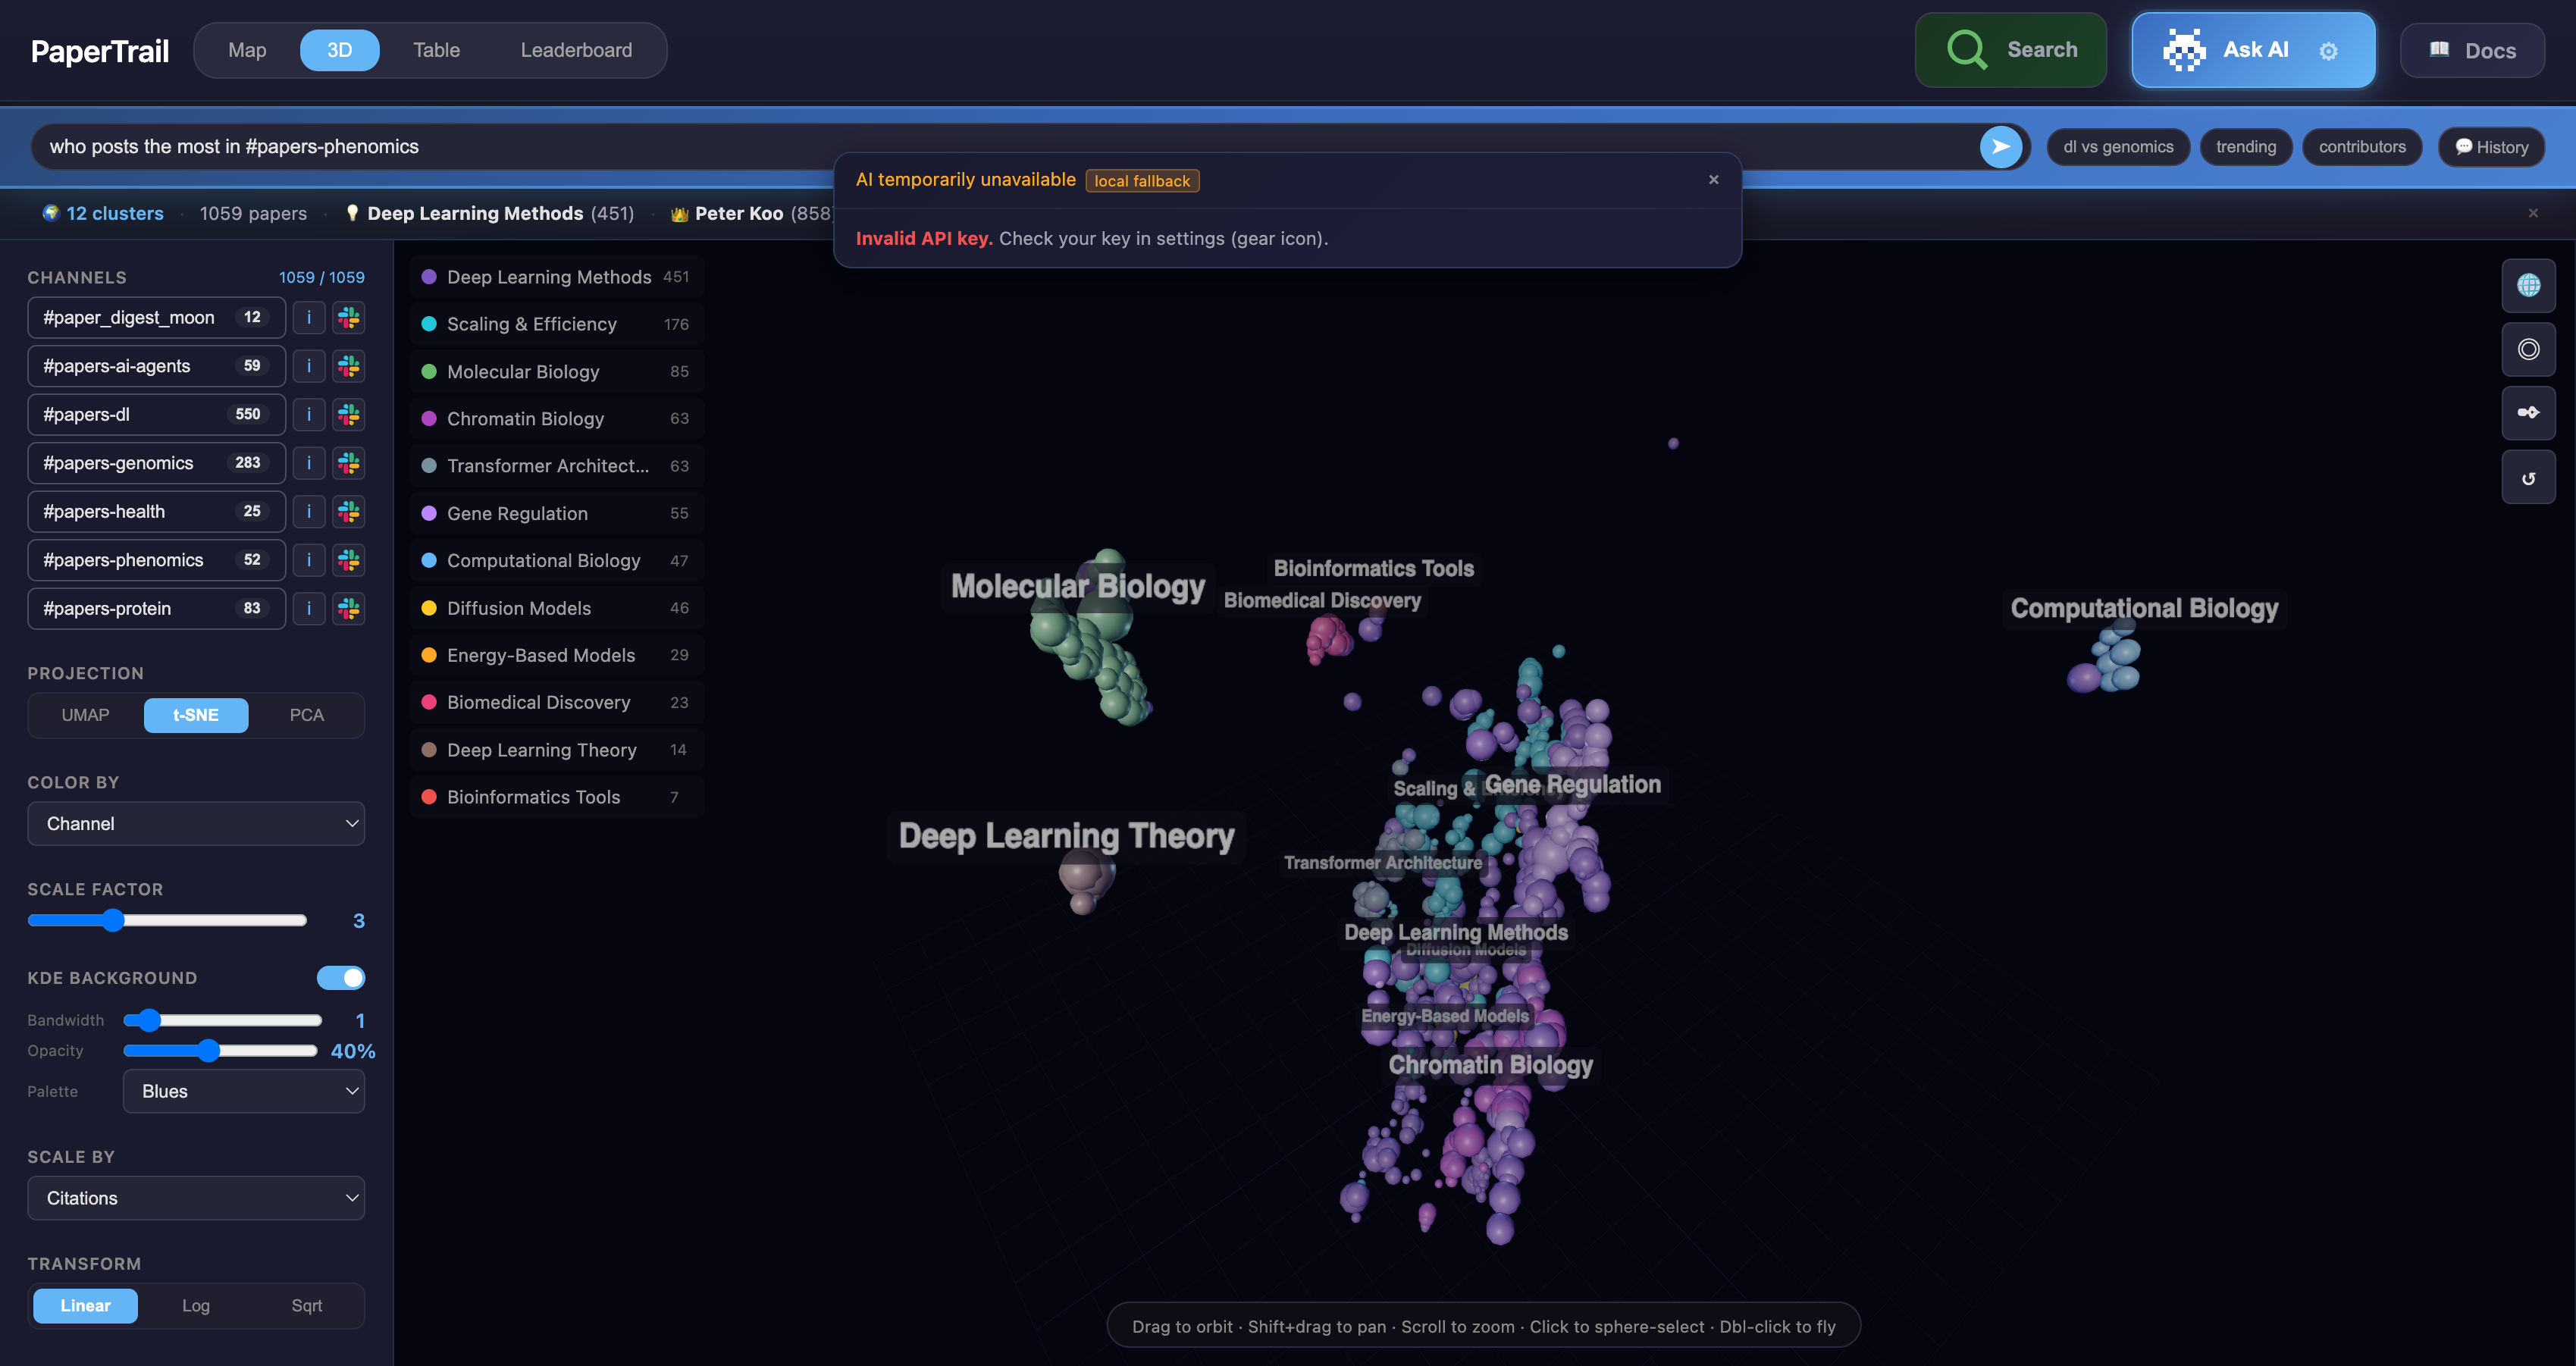
- Rotate: Click + drag
- Zoom: Scroll
- Click: Select paper
- Same color modes as Map view
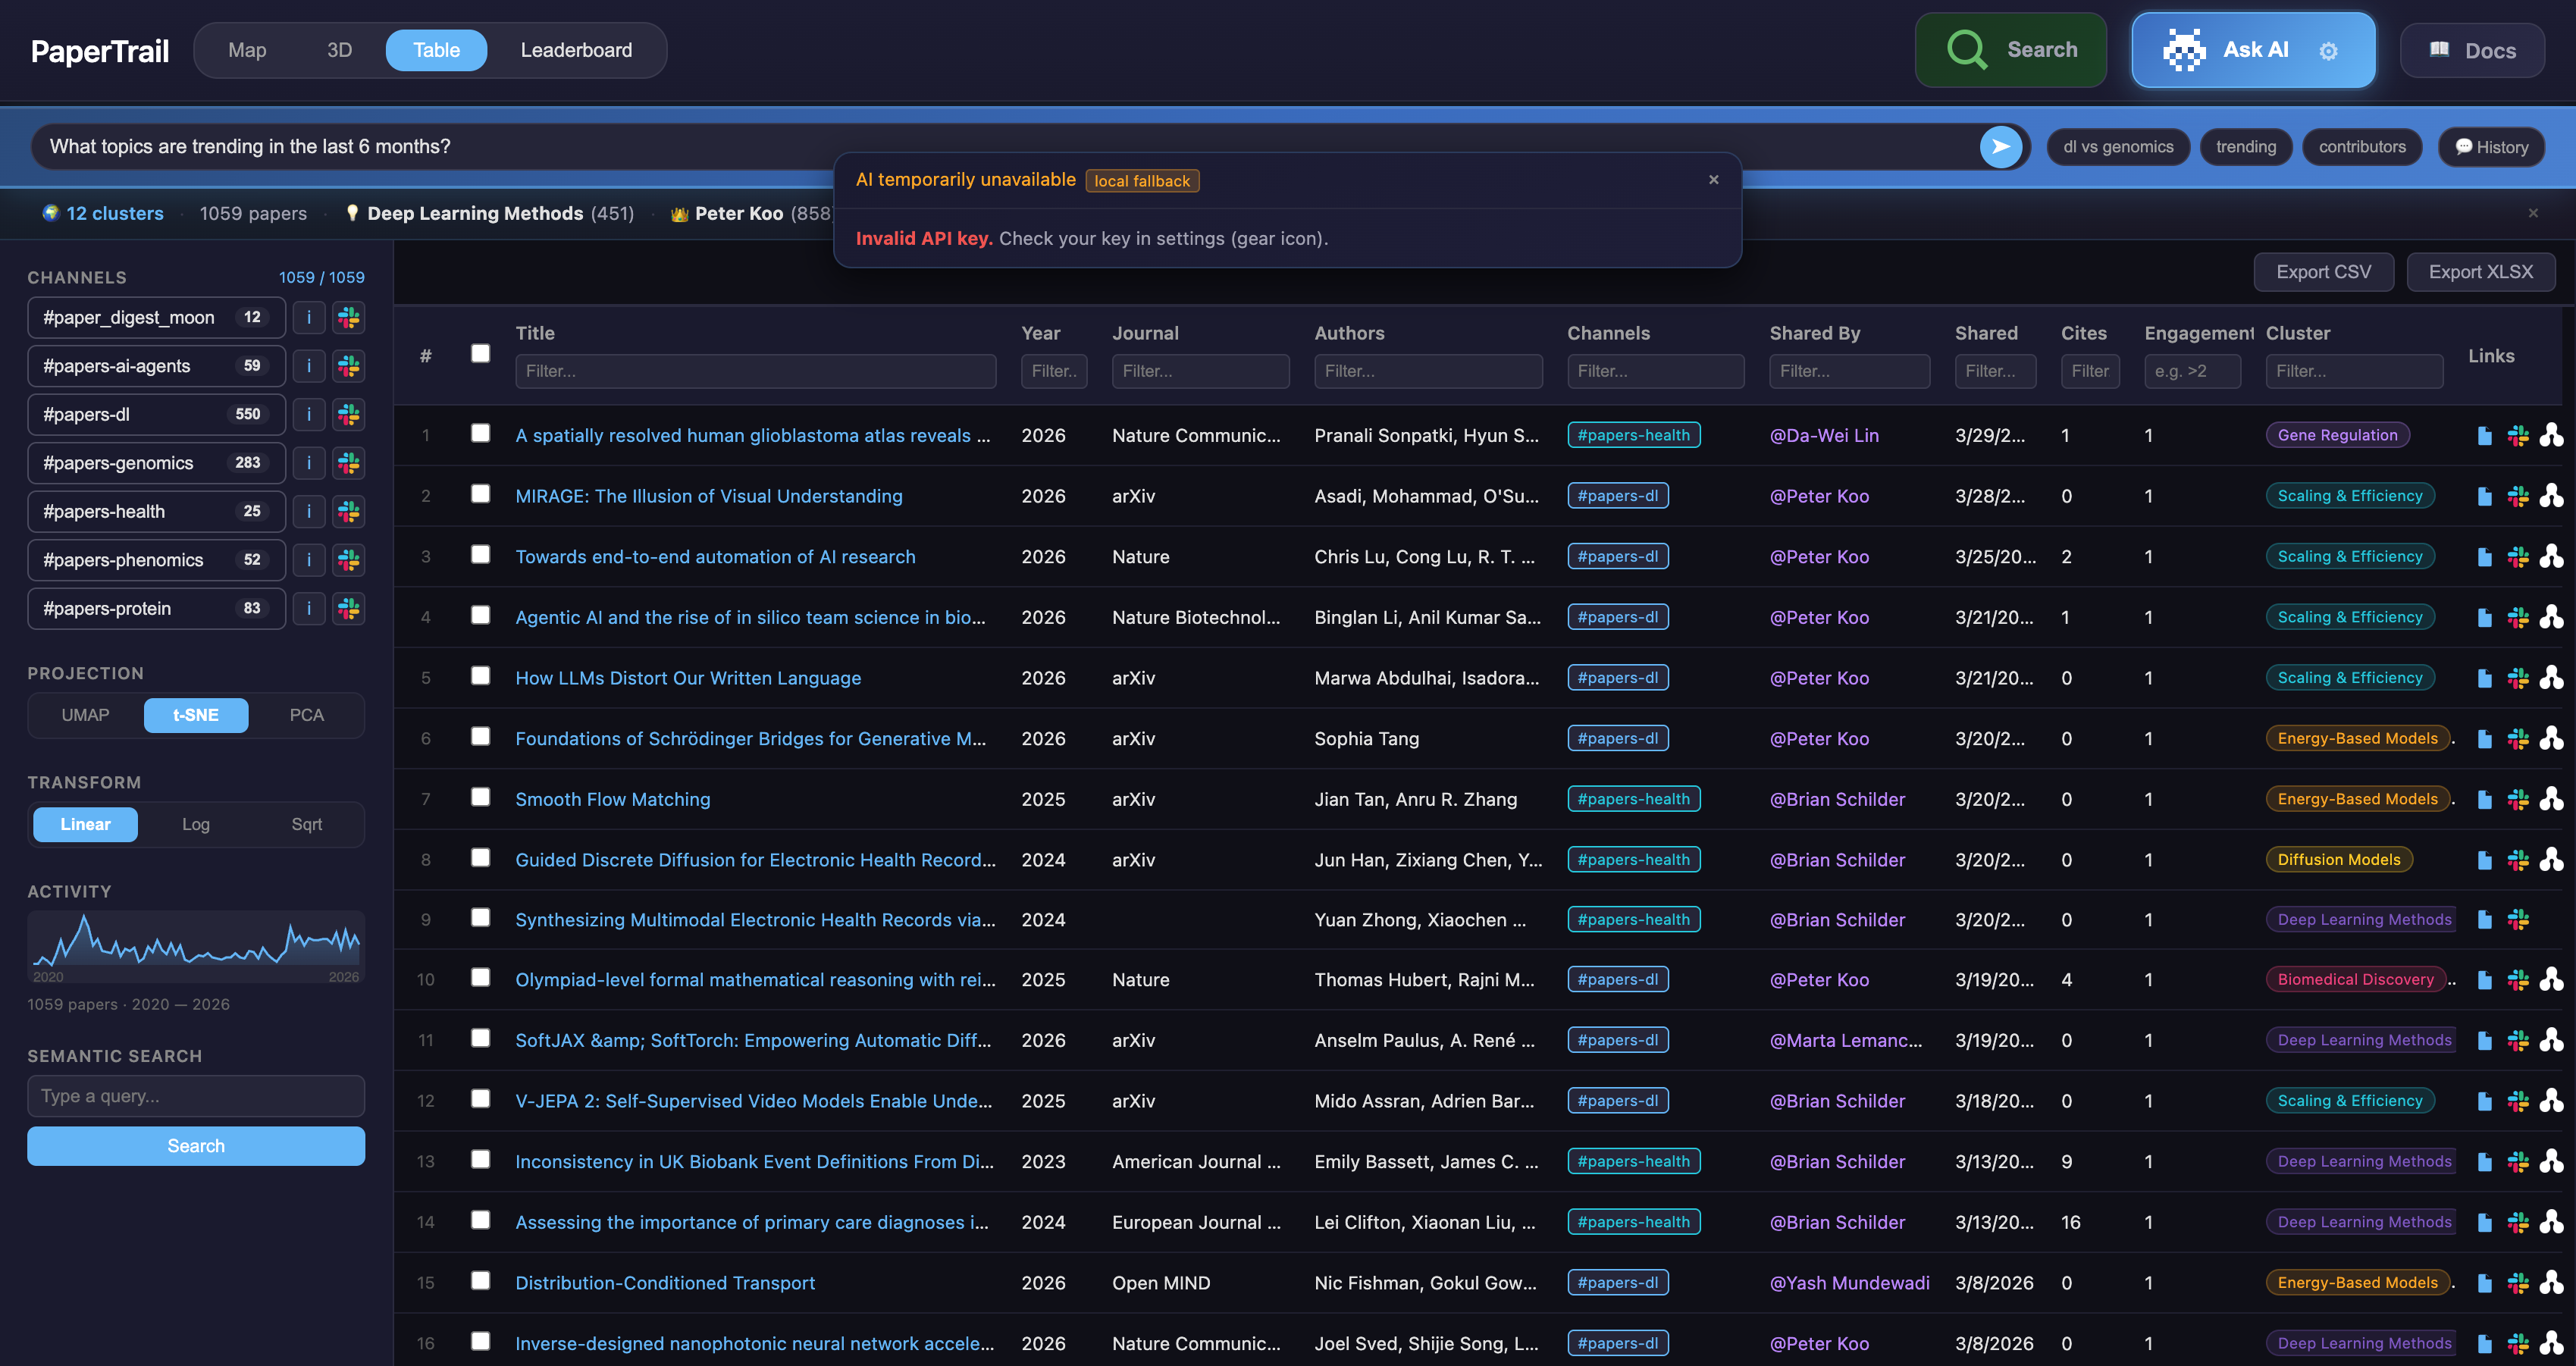
Table View
Sortable, filterable spreadsheet of all papers.
Columns: Title, Year, Journal, Authors, Channels, Shared By, Date Shared, Citations, Engagement, Cluster.
- Click column header to sort ascending/descending
- Filter row below headers — type to filter (supports
>5,>=10for numeric columns) - Click row to see paper detail panel
- Export CSV / Export XLSX buttons in top-right
- Slack icon links directly to the original Slack message
- Paper icon links to the paper URL
Leaderboard View
Rankings and statistics about your paper collection.
- Top Contributors — Who shares the most papers, with contribution heatmap
- Most Engaged — Papers with the most reactions + replies
- Most Cited — Highest citation count papers
- Topic Breakdown — Cluster sizes and proportions
- Channel Stats — Papers per channel with bar charts
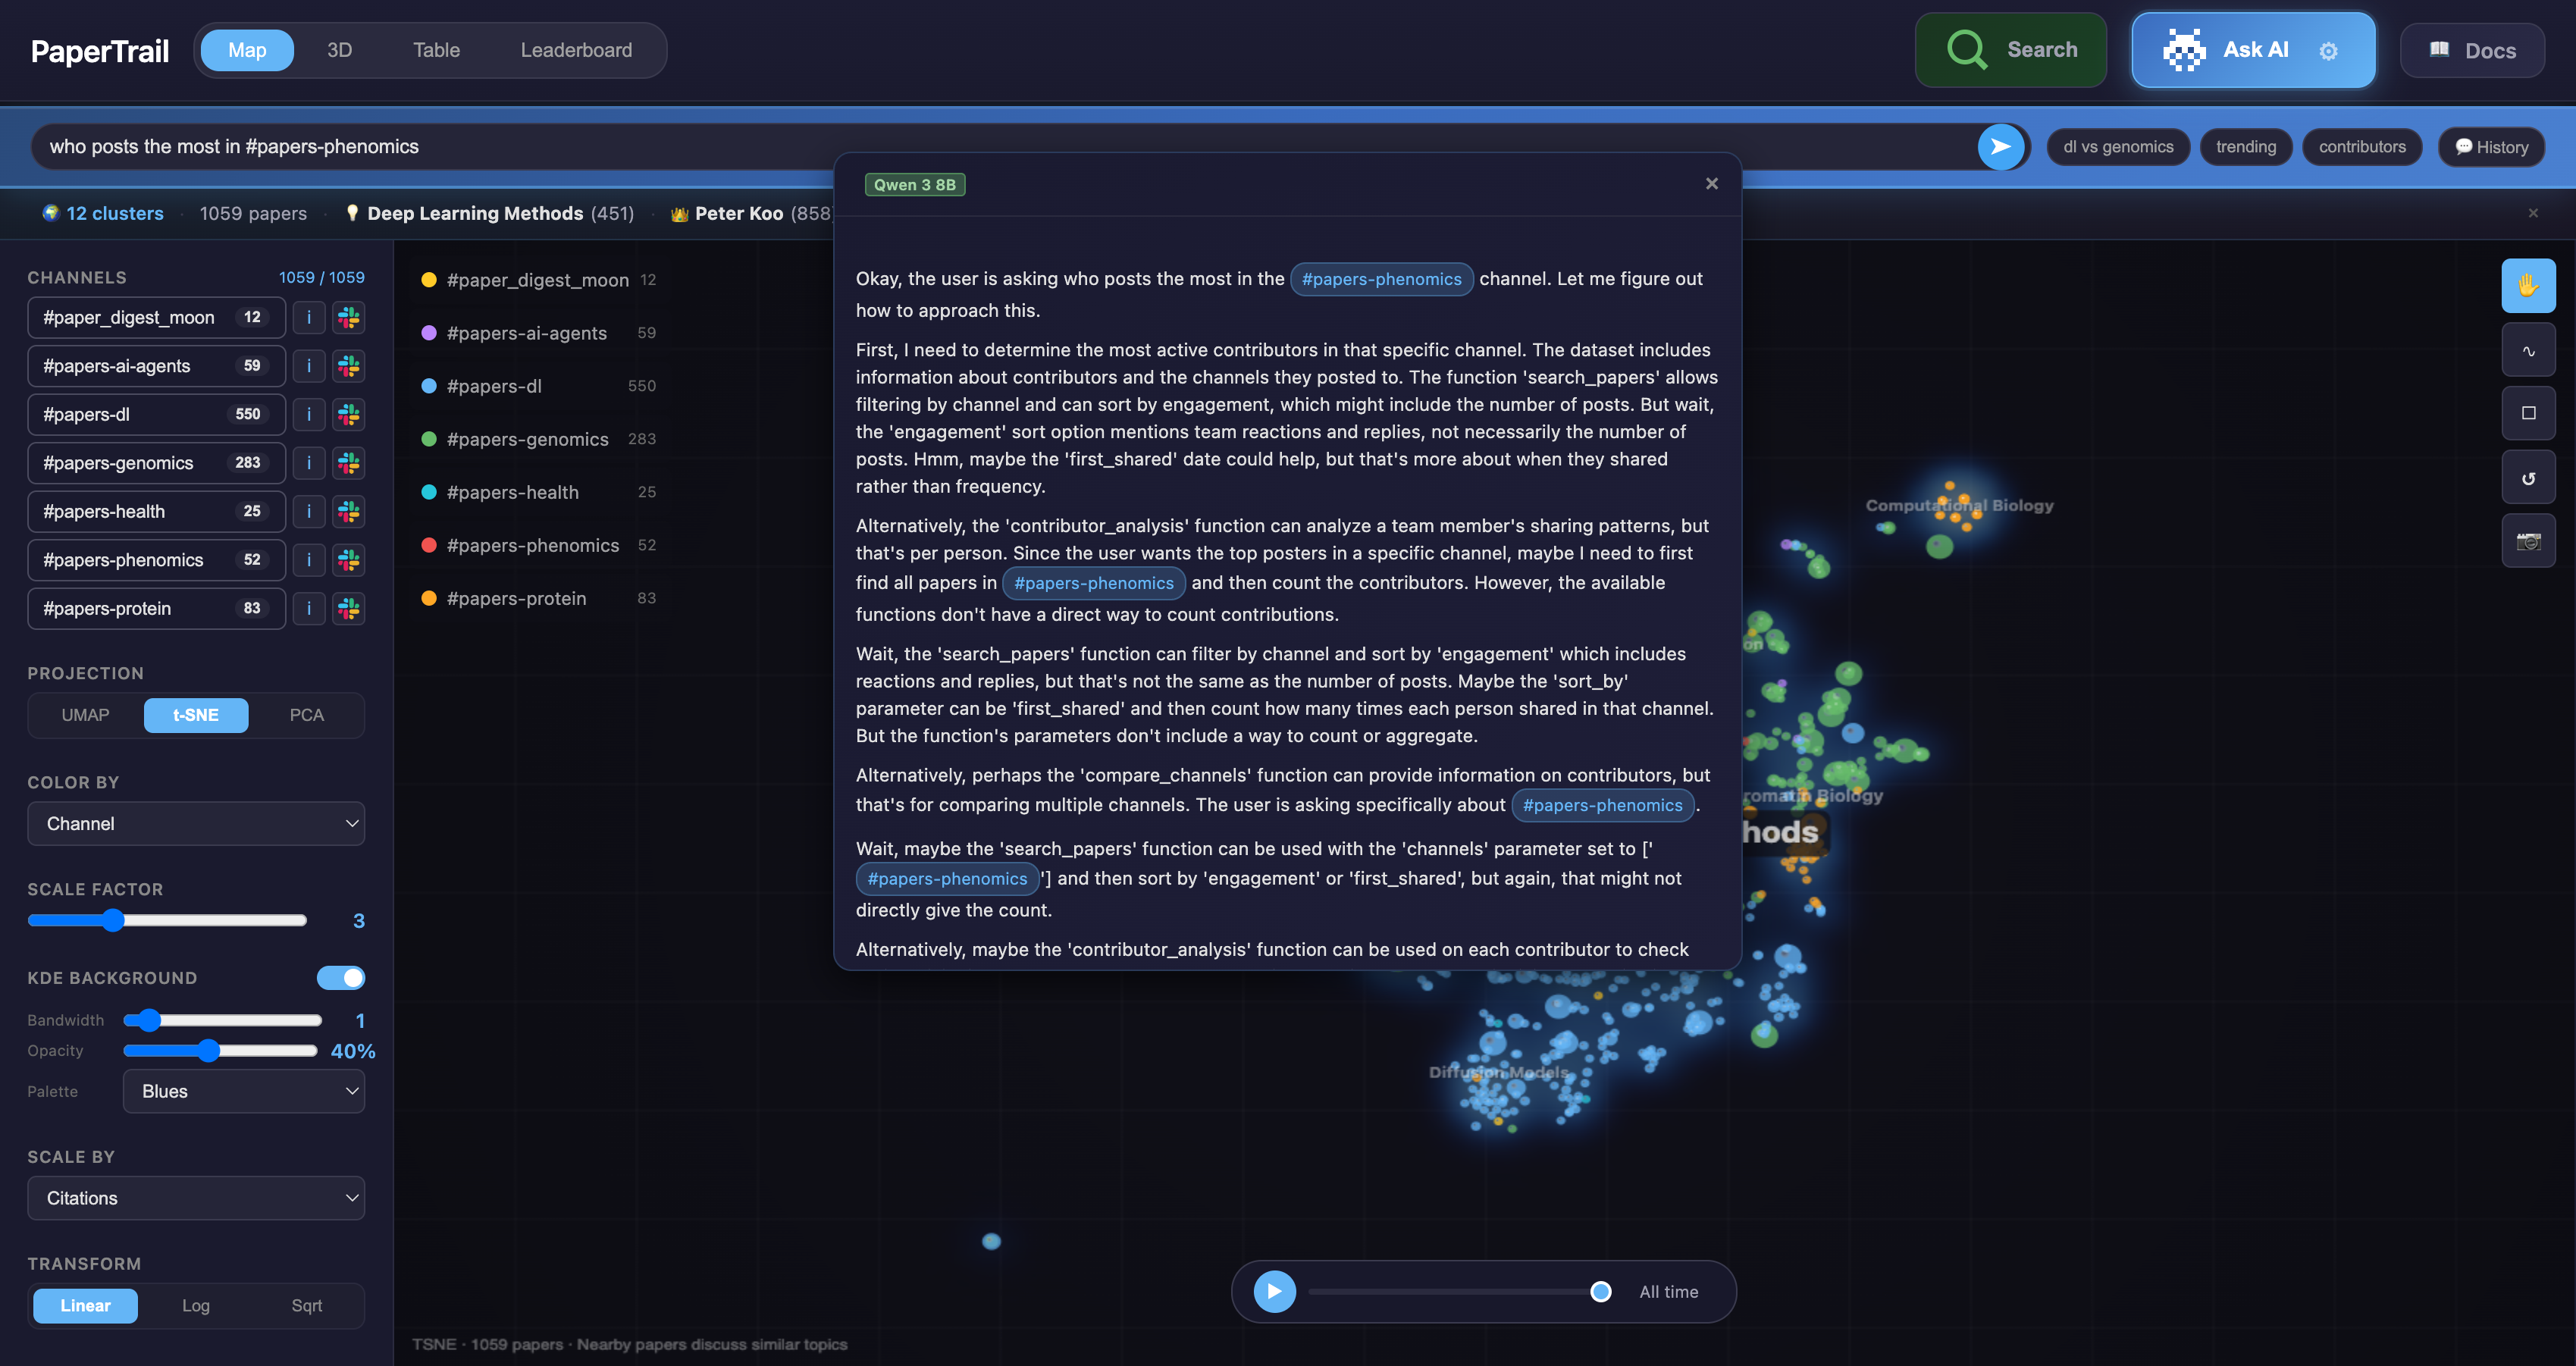
AI Agent
Click Ask AI in the top-right to open the AI-powered search bar.
What you can ask:
"What are the most cited papers about protein design?"— searches papers with tool use"Who contributes the most to genomics?"— contributor analysis"Compare #papers-dl and #papers-genomics"— channel comparison"What's trending in the last 6 months?"— trend analysis@Peter Kooor#papers-dl— autocomplete for people and channels
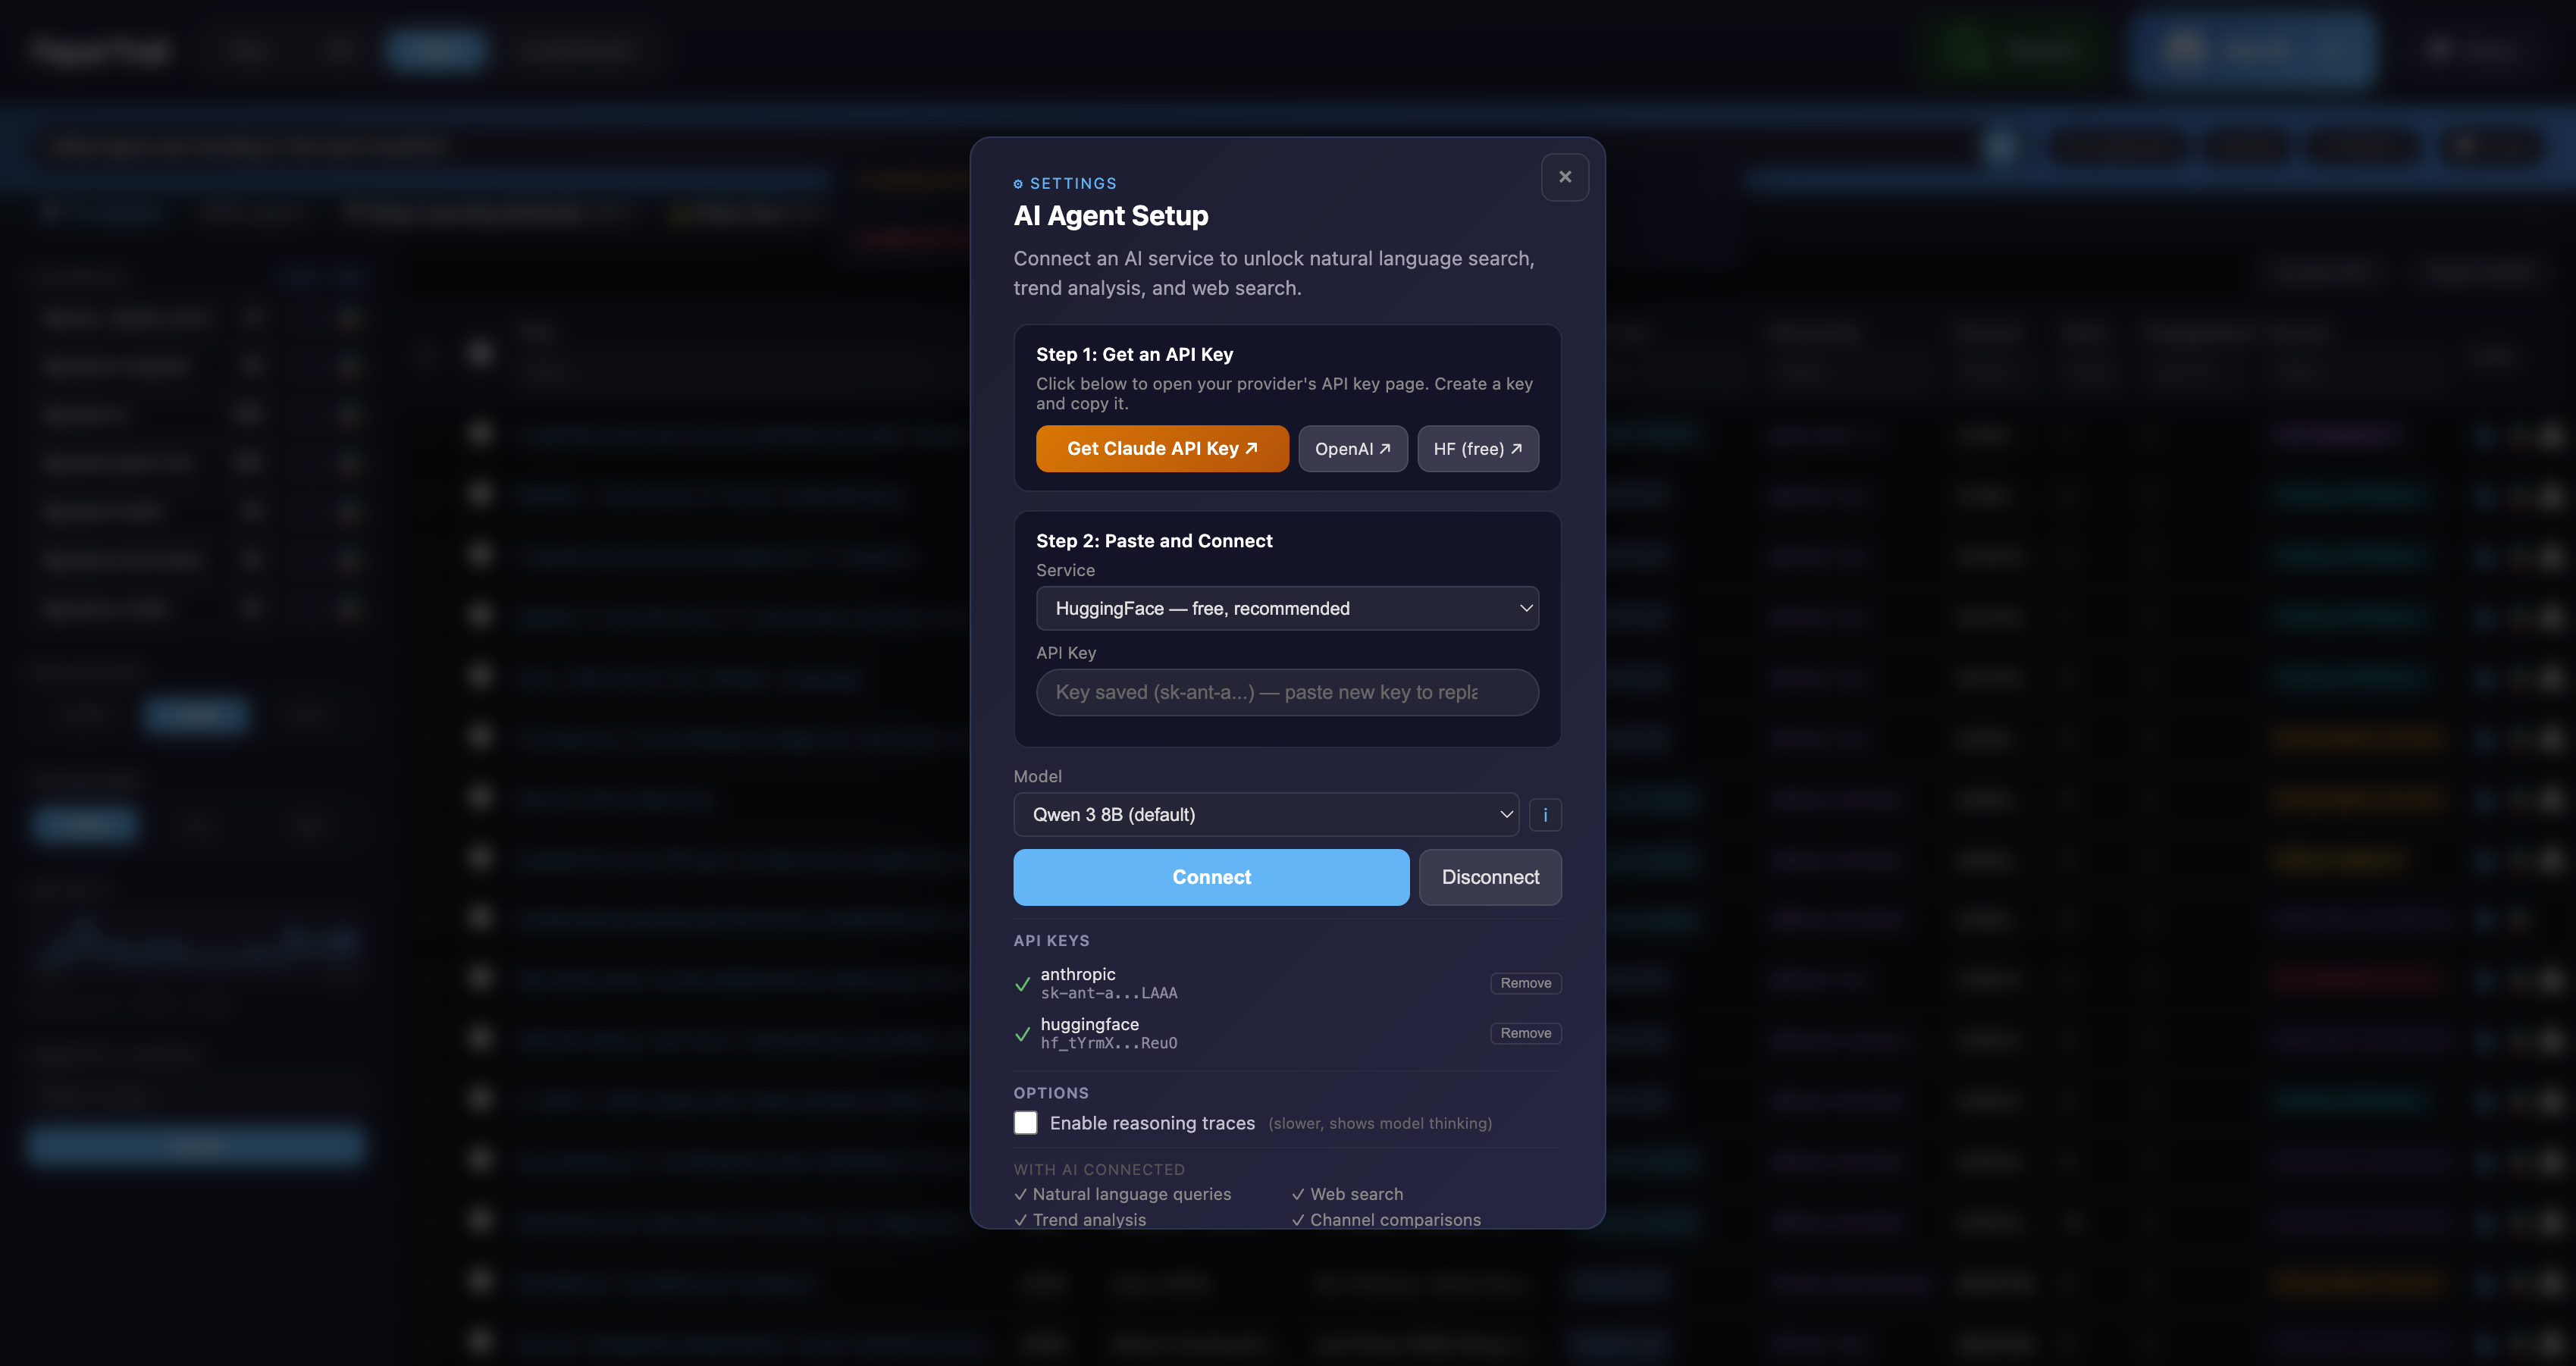
Configuration (click the gear icon inside Ask AI):
- Service: HuggingFace (free, default), Anthropic (Claude), OpenAI
- Model: Qwen 3 8B (default), plus 8 other models
- Reasoning traces: Optional toggle to show model thinking
- Chat history: Downloadable in JSON or CSV format
Semantic Search
Click Search to open the semantic search bar. Type a query and papers are ranked by content similarity — not keyword matching. Results are highlighted and sized by relevance.
Example queries:
single cell RNA sequencingattention mechanism transformerprotein folding prediction
Keyboard Shortcuts
| Key | Action |
|---|---|
1 / 2 / 3 |
Switch projection (UMAP/t-SNE/PCA) |
V |
Pan mode |
L |
Lasso select mode |
R |
Rectangle select mode |
/ |
Open AI agent |
? |
Show all shortcuts |
Esc |
Close panels |
| Arrow keys | Switch views |
URL Hash State
The dashboard saves your current view state in the URL hash. Share URLs like:
Parameters: p (projection), c (color mode), s (scale mode), z (zoom level).
Building the Dashboard
From CLI
From Python
from papertrail.preview import build_preview

build_preview(papers, output_path="dashboard.html", title="My Lab")
Automated Pipeline
The GitHub Actions pipeline automatically builds and deploys the dashboard weekly:
- Scrapes all configured Slack channels
- Enriches metadata via OpenAlex/Crossref/bioRxiv APIs
- Computes embeddings and hierarchical clusters
- Builds dashboard and deploys to GitHub Pages
See Deployment Guide for setup instructions.
Deployment
The dashboard is deployed to GitHub Pages at:
Where <workspace> is derived from your Slack workspace URL in config.yml. For example, koolab.slack.com deploys to /koolab/.
The old /dashboard/ path redirects automatically.