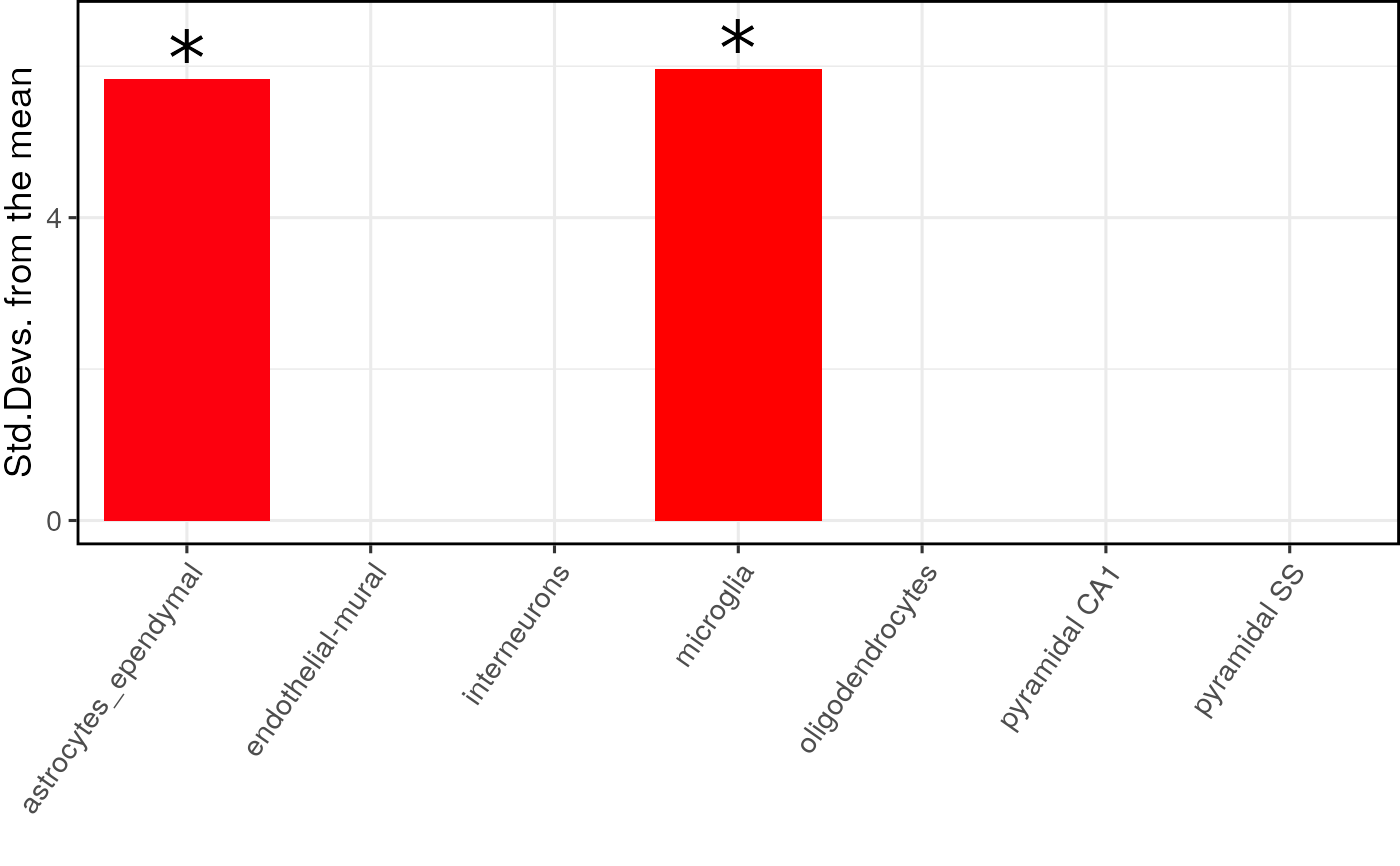
ewce_plot generates plots of EWCE enrichment results
ewce_plot(
  total_res,
  mtc_method = "bonferroni",
  ctd = NULL,
  align = "v",
  rel_heights = c(0.3, 1),
  axis = "lr"
)
Arguments
| total_res | results dataframe generated using bootstrap_enrichment_test or ewce_expression_data functions. Multiple results tables can be merged into one results table, as long as the 'list' column is set to distinguish them. |
|---|---|
| mtc_method | method to be used for multiple testing correction. Argument is passed to p.adjust. Valid options are "holm", "hochberg", "hommel", "bonferroni", "BH", "BY", |
| ctd | Should be provided so that the dendrogram can be taken from it and added to plots |
| align | (optional) Specifies whether graphs in the grid should be horizontally ("h") or vertically ("v") aligned. Options are "none" (default), "hv" (align in both directions), "h", and "v". |
| rel_heights | (optional) Numerical vector of relative rows heights. Works just as
|
| axis | (optional) Specifies whether graphs should be aligned by the left ("l"), right ("r"), top ("t"), or bottom ("b")
margins. Options are "none" (default), or a string of any combination of l, r, t, and b in any order (e.g. "tblr" or "rlbt" for aligning all margins).
Must be specified if any of the graphs are complex (e.g. faceted) and alignment is specified and desired. See |
Value
A ggplot containing the plot
Examples
## Bootstrap significance test, ## no control for transcript length or GC content ## Use pre-computed results to speed up example full_results <- EWCE::example_bootstrap_results() ### Skip this for example purposes ## Load the single cell data # ctd <- ewceData::ctd() # hits <- ewceData::example_genelist() # full_results <- EWCE::bootstrap_enrichment_test( # sct_data = ctd, # hits = hits, # annotLevel = 1, # sctSpecies = "mouse", # genelistSpecies = "human" # ) ## Generate the plot print(EWCE::ewce_plot( total_res = full_results$results, mtc_method = "BH" ))#>#> $plain#>